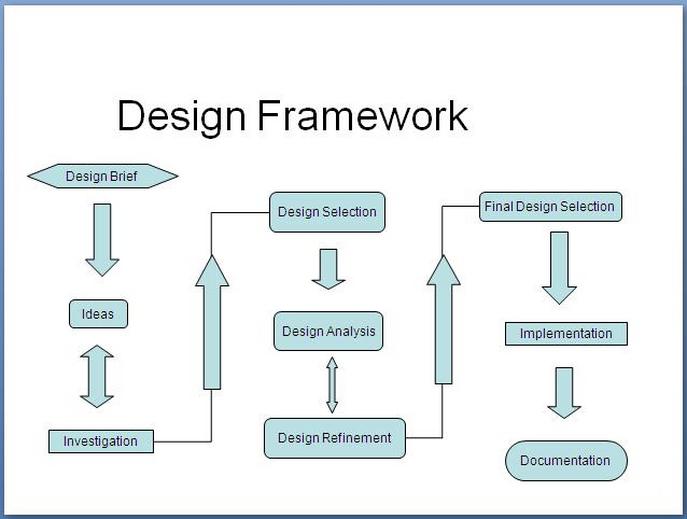
Process
i
Phase 1:
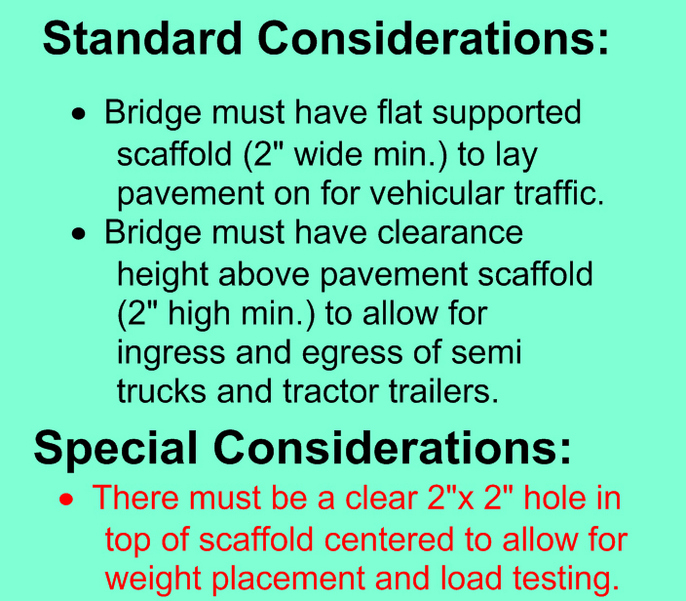
Lets begin by familiarizing yourself with the project guidlines and goals...make notes as necessary in your Engineering Notebook
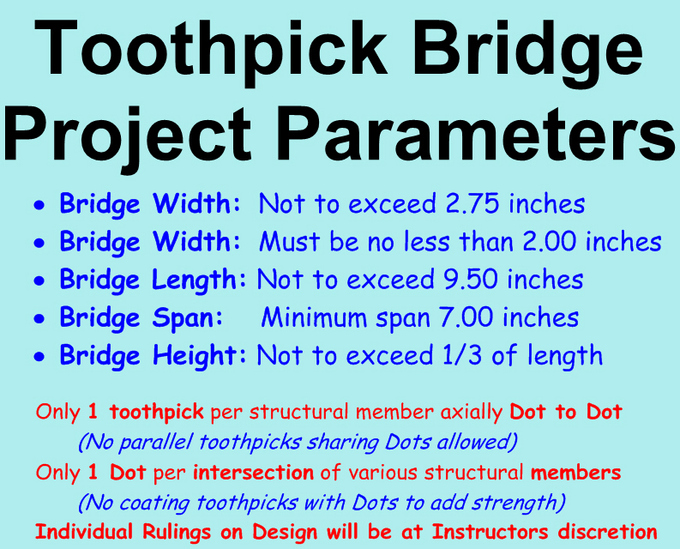
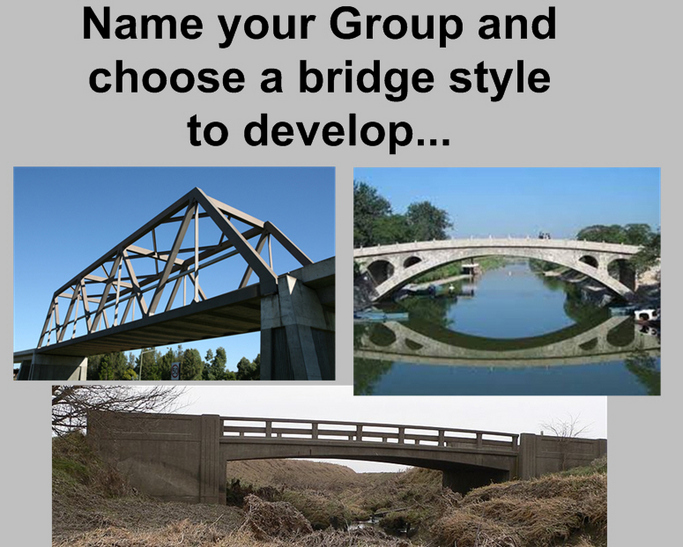
Choose a bridge type to use as your initial example to help you design and build your toothpick bridge.
As you brainstorm, remember the bridge must be functional for traffic. This model is a "Prototype" of a final project which will be used to sell the client on your bridge design concept.
Now that we have discussed the various constraints of the contest...Lets begin the real work!
|
Don't Forget...
...Process!
|

Phase 2:
Document in your Engineering Notebook work and itemize materials:
- How many Dots used
- How many Toothpicks used
- Type of bridge design chosen
See Documentation Page for more details
Now that you have finished your bridge construction phase...
Step back and take a look at your design...
Look around the room at the design of others...
Now write a prediction in your Engineering Notebook as to how you think your group's bridge design will do in the stress test. (Loading the bridge with weights until failure occurs)
Give reasons why you believe as you do about your predictions.
Photograph Your Completed Bridge with Your Group Name on a Custom Name Placard. Post your photo onto your Web Portfolio.
Weigh your bridge with a triple beam or electronic scale. Record its mass in your engineering notebook.
Phase 3:
After recording all of the above information
in your Engineering Notebook...
Photograph your bridge at or near its Ultimate Failure Point as a Record of Structural Testing. Post this picture with documentation of how many weights your bridge required to achieve failure and a brief written reflection.
Weigh 5 of the weights used on a triple beam or electronic scale. Record this value in your engineering notebook. Calculate the average value for a single weight by dividing the overall mass by 5.
Now calculate your bridges efficiency:
E = load supported (units) / weight of bridge (units)
Write a Reflective Analysis on the following topics:
- Did my group's bridge do as well as I expected?
- Why or Why not?
- If not, what could we have done to make the bridge stronger?
- Could more collaboration have produced a better bridge?
- Could comparing all group ideas result in a "best built" bridge?
- How did my bridge's efficiency compare with others in the group?
- Was the overall winner the most efficient?
- If not what might this mean to you as a builder? As a client?
Phase 4 (Calculations and Analysis):
Create a data analysis section in your notebook and include the following equations/calculations:
Total materials = total number of dots and total number of toothpicks
Calculate toothpicks as percent of total materials
Calculate dots as percent of total materials.
Calculate percent increase or decrease in toothpicks between initial
design and final design.
Calculate percent increase or decrease in dots between initial
design and final design.
This percentage is the accuracy of your design with respect to your actual building needs.
1. Why might this number important in business?
2. Would it be better if this number were larger or smaller? Why?
3. What future steps could you take to get this percentage to be better?
Include your Efficiency calculations within this section
Calculate average weight (number of washers) held
per structural member (toothpick)
Graph 1:
Create a graph using your number of weights as the dependant variable, and the number of toothpicks as your independent variable, and plot your (x, y) = (total weight, total toothpicks). Connect a line from this point to the origin and create an equation for this line. y = mx + b
Examine the equations and graphs for all teams in a gallery walk and return to your team group to discuss what changes, and what remains constant when comparing all of the graphs. Discuss why. Do these graphs have any real value as an analytical tool? Why or why not? Share out your team’s thoughts during a class discussion after writing your answers and rationale.
Graph 2:
Create a graph using your average weight held per structural member as a slope (m), and plot a series of points starting from the origin using this slope. Connect a line from these points to the origin and create an equation for this line.
Examine the equations and graphs for all teams in a gallery walk and return to your team group to discuss what changes, and what remains constant when comparing all of the graphs. Discuss why. Do these graphs have any real value as an analytical tool? Why or why not? Share out your team’s thoughts during a class discussion after writing your answers and rationale.
Group questions:
1. How do the slopes from your team’s graph 1 and 2 compare with one
another?
2. Is there a pattern you might recognize? If so what might it mean?
3. Is there a pattern when you compare all of the various team’s graphs
as a group?
4. Is there a pattern you might recognize? If so what might it mean?
Graph 3:
Find the overall range for all of the team’s outputs (number of toothpicks used) and a region of domain for all of the inputs (average weight per structural member) to create a set of axis for a class wide graph.
Create a graph using average weight per structural member as the dependant variable, and the number of toothpicks as your independent variable, and plot your (x, y) = (average weight, total toothpicks). Now each team will plot their respective (x, y) point onto the group class graph to create a scatter plot
Analyze the group graph for the following traits:
1. Do these points make a nice scatter plot or are they completely
random?
2. How does your point look with respect to the rest of the scatter plot?
Is it an outlier?
3. Who had the lowest average point in the group?
4. Who had the highest average point in the group?
5. Who had the lowest number of toothpicks in the group?
6. Who had the highest number of toothpicks in the group?
7. Did bridge performance relate directly to how many, or few,
toothpicks were used?
8. Which of these two possibilities is better for your company?
9. Can you draw a “best fit” trend line through the scatter plot?
10. Make an equation for the trend line.
Looking at this whole group graph draw a box bounded horizontally by the highest and lowest output values, and vertically by the highest and lowest input variables. Now connect the lower left corner to the upper left corner of the box you just made. Create an equation for this line suing point slope form as a starting point (y - y1) = m(x - x1).
Examine group artifact and answer the following:
1. How does the slope of this line does it compare with our
“best fit” trend line?
2. Does this new line have any meaning to us analytically? Why or why not?
3. Does seeing this line make you rethink your “best fit” trend
line decision?
4. Can companies use data like this for future design decisions?
If so, how?
Phase 5 (extension and enrichment):
Fun and Interesting:
Click the picture below...
Watch the entire movie...
Discuss your thoughts on why this happened

Now lets look at the virtual bridge building software on our computers...West Point Bridge Builder

|
Click on the icon on your desktop that looks like the image below:

PLTW Proprietary Program
|
Engage in class discussion regarding use of this program
...Then follow the directions for a truss bridge design
...Then follow the directions for a truss bridge design
- Create a truss bridge over the default span
- After you have achieved a stable design...load test
- Once failure has been avoided...check forces in ALL members
- Reduce member sizes wherever possible (retest as necessary)
- Minimize cost of bridge until failure is barely avoided
- Save your design and EnGrade file to Mr. Taylor
- Lowest Cost Functional Bridge Wins Bid and Contract!!!
Now compare your design to your peer's designs...
...Engage in whole class discussion and reflection about relative performance and design merits.
...Engage in whole class discussion and reflection about relative performance and design merits.
Now retry the previous activity with all aspects except using arch bridge instead of truss bridge. When finished save and submit file on EnGrade to Mr. Taylor.
Next compare the two designs costs and discuss which style bridge was a better value for the money in a whole class activity.
Next compare the two designs costs and discuss which style bridge was a better value for the money in a whole class activity.
Note:
Review your Rubrics as a self assessment activity prior to submitting final completion acknowledgement to Mr. Taylor on EnGrade. Attach a completed copy of your self assessed rubric to the EnGrade message.
Artifact Presentation and Reflection:
A gallery walk of each groups various Artifacts followed by a group discussion about the various approaches and diversity. After reflection and group analysis, construct a final presentation documenting your process and what new things you have learned about Geometry and Excel Spreadsheets for your class and teacher. Your presentation artifact shall be a PowerPoint presentation of no less that 5 slides and no more than 15. Your presentation should address all factors considered and how looking at the other groups work may have affected your final analysis.
All PowerPoint presentations should be of professional and conservative business or scientific format. These shall then be posted on an ongoing web based class project site and each persons personal web portfolio for display on the internet. All pages and portfolios shall conform to internet safety standards and acceptable language and content policies.
A formal peer review shall be done as a discussion post on the class webpage and shall be completed appropriate to said venue with regard to commentary, language and content. This review/reflection is to be a graded activity of self and peer assessment skills.