Process
i
This is a Three Part Assignment:
Part 1:
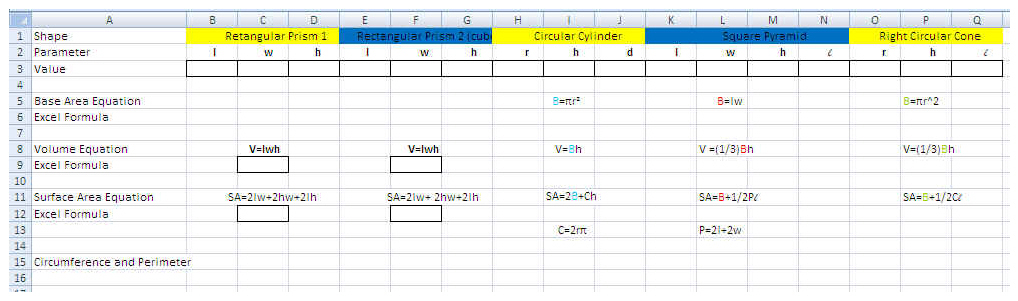
Your first assignment is to create a spreadsheet in Excel which matches the given artifact photo...make it look as identical as you possibly can, cell location of data or text, cell border and line weight, cell color as necessary...recreate the spreadsheet accurately.
After you have successfully completed this activity:
Down load and save a copy onto your desktop named as:
"YourName Solid Object Lab Spreadsheet 1 - P#"
Upload this to your web portfolio with a link name same as your file.
Part 1:
Your first assignment is to create a spreadsheet in Excel which matches the given artifact photo...make it look as identical as you possibly can, cell location of data or text, cell border and line weight, cell color as necessary...recreate the spreadsheet accurately.
After you have successfully completed this activity:
Down load and save a copy onto your desktop named as:
"YourName Solid Object Lab Spreadsheet 1 - P#"
Upload this to your web portfolio with a link name same as your file.
Part 2:
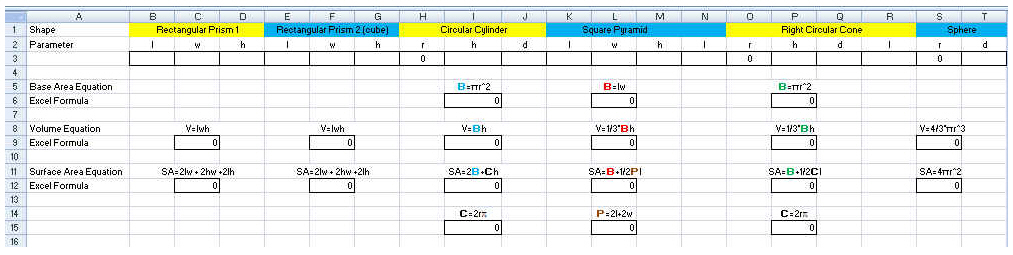
Your second assignment is to create another spreadsheet in Excel...you will do this by opening the first spreadsheet to your desktop, but using a new name to save this file as instructed. Notice some modifications have been made to the spreadsheet...this is a large part of engineering...revisions. You should learn to expect them and not to worry when they are required. Modify your spreadsheet now as necessary. This assignment will involve the insertion of the formula algorithms for the various objects and their respective calculations done during the Solid Object Lab Activity. As programmed cells these will now automatically do all of the calculations for you once your measurement data has been entered. Use the Formula Sheet for assistance with which formula goes with which object shape and attribute to be assessed.
Notice that as shown in the below example your spreadsheet will have zeros in the data cell locations where all of your answers will eventually appear...do not worry. This is because you have input no dimensions or measurements yet (please do not enter any data until later), therefore your spreadsheet has no data to do the calculations with, thus showing a zero value as your results for now. Use this as an indicator of when you have formatted your programming correctly...if zeros appear you are probably good, if an error message appears you need to look at your syntax (the format of your programmed functions).
After you have successfully completed this activity:
Down load and save a copy onto your desktop named as:
"YourName Solid Object Lab Spreadsheet 2 - P#"
Upload this to your web portfolio with a link name same as your file.
Part 3:
Your third assignment is to complete the final spreadsheet in Excel...you will open the second spreadsheet to your desktop, but using a new name to save this file as instructed. This assignment will involve the insertion of the measurement data which you acquired using the dial calipers for the various shapes used during the Solid Object Lab Activity As you insert this data into the appropriate cells you will notice that the programmed cells will automatically do all of the calculations for you and begin and reflect the outputs in the appropriate cells. Once your measurement data has been completely entered you have created a solution key for the original lab activity and are now finished with the last aspect of this assignment. Your spreadsheet should be completely finished with all necessary calculations you need to self assess your original hand calculated work. Congratulations.
If you consider what you have accomplished...you now have an automated spreadsheet which will calculate surface area and volume for most of the commonly occurring solid objects. You therefore can use this resource over and over again saving much time and effort on your part. Do not lose spreadsheet two...this is the resource of which I speak.
After you have successfully completed this activity:
Down load and save a copy onto your desktop named as:
"YourName Solid Object Lab Spreadsheet 3 - P#"
Upload this to your web portfolio with a link name same as your file.
You should now have three separate links, one for each spreadsheet file.
Note:
No preview is available for Part 3, but you can check the Answer Key once your instructor unlocks the protection. This viewing will be done as a whole class activity once
all students have completed and uploaded their respective work to the instructor and to their web portfolios.
all students have completed and uploaded their respective work to the instructor and to their web portfolios.
Artifact Presentation and Reflection:
A gallery walk of each groups Initial Spreadsheet Artifacts followed by a group discussion about the various approaches and uniformity. After reflection and group analysis, construct a final presentation documenting your process and what new things you have learned about Geometry and Excel Spreadsheets for your class and teacher. Your presentation artifact shall be a PowerPoint presentation of no less that 5 slides and no more than 15. Your presentation should address all factors considered and how looking at the other groups work may have affected your final analysis.
All PowerPoint presentations should be of professional and conservative business or scientific format. These shall then be posted on an ongoing web based class project site and each persons personal web portfolio for display on the internet. All pages and portfolios shall conform to internet safety standards and acceptable language and content policies.
A formal peer review shall be done as a discussion post on the class webpage and shall be completed appropriate to said venue with regard to commentary, language and content. This review/reflection is to be a graded activity of self and peer assessment skills.
Click here for Teacher Resources