Process
i
Essential Questions:
|
Process Descriptors: (Read each part and complete as directed)
|
Brainstorming:
Using a protractor create from paper or cardboard a series of triangles representing all possible variations of Theta (0 though 90 degrees) in 10 degree increments.
For example: 0, 10, 20, ... ,80, 90 degrees. Using the protractor as a fixed radius for the hypotenuse values of the created triangles, consider possible ways to show the varying relationships that exist between the sides as Theta changes between 0 degrees through 360 degrees. See below example of lay out to get all triangles on to fit one sheet: 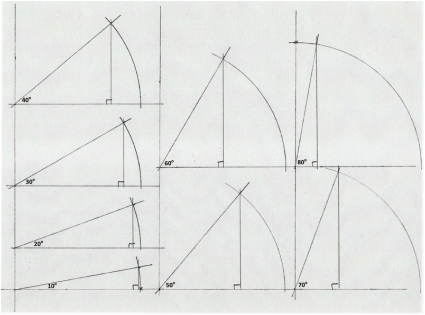
Hints:
1 Consider the relationship between the opposite side and adjacent side of any right triangle as they relate to each other when theta is changing. 2 What happens to one when the other increases? Why? 3 If theta increases what happens to the opposite side? 4 If theta increases what happens to the adjacent side? Document Ideas:
Write down your thoughts and include sketches or diagrams to help support your ideas. How might these be useful to your group in creating a graphical representation of these changing conditions?
These rough notes are part of your evaluation so do not skip this step or lose these documents. Refine Thoughts/Ideas:
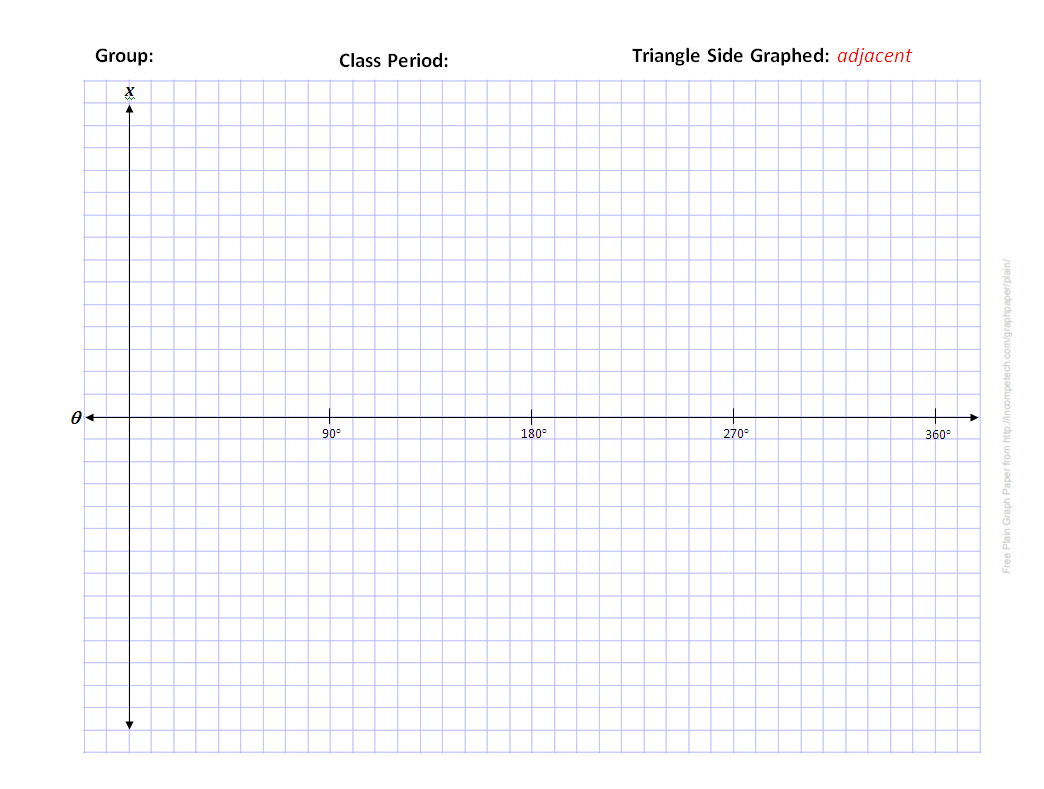
Utilizing your various triangle resources as a template, guide, integral part, or any other way which you may deem useful, consider how the creation of these various paper triangles might help you to formulate a plan, and use the axis grid paper example below to create two artifacts which might demonstrate the following:
1) One artifact showing how the opposite side is effected (changes) as theta ranges from 0 to 360 degrees rotation. 2) Another artifact showing how the adjacent side is effected (changes) as theta ranges from 0 to 360 degrees rotation. Carefully consider all possiblities with one another. You will work collaboratively, but each group member must produce their own grid sheets for evaluation by instructor. In other words, each member will have an opposite side axis artifact completed, and an adjacent side axis artifact completed. These will be handy later for the group artifact creation, which will serve as a classroom display. Axis grid paper examples:
Cooperatively Choose a Model:
Choose a graphical representation model for your artifact. Collaborate and experiment. Do not be afraid to try more than one idea initially and then decide which shows the most promise. (Think of what you might have learned in previous labs or lessons which might serve as a useful guide to you approach).
Create a Formal Proposal for a Teacher Review:
Create a your Individual Graphical Presentation Artifacts...
...and one group generated brief presentation of your findings for your class and teacher which shall include your groups formal data sheet as an Excel spreadsheet or Microsoft Word document, and a PowerPoint presentation of no less that 5 slides and no more than 15 slides. Your PowerPoint presentation should: Address all factors considered by your group, what difficulties you may have encountered and how you overcame said difficulties, and how looking at the other group's models may have affected your design process or other interpretations of your observations. All PowerPoint presentations should be of professional and conservative business or scientific format. These shall then be posted on an ongoing web based class project site and each persons personal web portfolio for display on the internet. All pages and portfolios shall conform to internet safety standards and acceptable language and content policies. Artifact Creation Rubric Oral Presentation Rubric Consider Teacher Feedback:
Instructor may provide guiding questions or recommendations for further research which then shall be taken into consideration to help refine or modify graphical representation artifact or PowerPoint presentation.
Make any Necessary Adjustment/Refinements:
The above modifications shall be applied as necessary, and the amended artifacts shall be re-evaluated for improved grade, or enhanced experience, of the group as a whole.
|

Create Classroom and Web-based Artifact/Model:
|
Create a triangle collage on each of the axis grid sheets using paper triangle made from the layout example sheet format:
1 You must create four complete triangle sheets for each axis grid example. (That means four for the opposite graphical display, and four more for the adjacent graphical display) 2 Once you have laid out the triangles, color with a green highlighter the opposite sides of each triangle on four of the layout sheets. 3 Next color with a pink highlighter the adjacent side of the triangles for the other four layout sheets. (Each of the triangles should have ONLY one side colored) 4 Now cut out each triangle and arrange them on the axis grid sheet to display the appropriate colored side on the appropriate position of Theta axis. 5 You will not be able to avoid some overlap and triangle exposure but what is important is the colored sides create an unobstructed view of the relationship between Theta values and the side length you are displaying. 6 Then submit this group artifact product to instructor to post for public display. Extension Activity (Optional at Instructor's Discretion): Create a dedicated page on you personal web portfolio which includes an introduction, pictures or scans, your data sheet and PowerPoint embedded or linked, and a summary of what you learned. Submit to Mr. Taylor as a "turn in" on Engrade: A Word document containing: A text copy of your summary as it appears on your web portfolio, your data sheet (embedded Excel if necessary), and just below the summary text an active link to your site that links directly to the page you created. |
Peer Assessment of Group Members:
|
Complete a peer evaluation assessment of your group members. This will be anonymous between students, but will help to adjust peer grades with respect to their cooperative work ethic and mannerisms. No one wants to have an unpleasant experience when working in groups...this will help to drive discussions between Mr. Taylor and individuals with regards to attitude, work ethic, and respect.
Please BE HONEST with your rubric scores. You will be required to do one for each member of your group. Complete the rubrics to assess all members of your group. (each page is for an individual member). Mr. Taylor will compare your assessments with his anecdotal notes and observations. These should support one another if you are honest with your feedback...if they do not a meeting with Mr. Taylor may be required to discuss said discrepancies. Click here to download your Peer Assessment Rubric. After completing this save it to your desktop as a file name formatted as follows: P#_Group#_F_Lastname (Meaning: period number, group number, First initial, Last name) then submit this file as a "turn in" to Mr. Taylor on Engrade. |